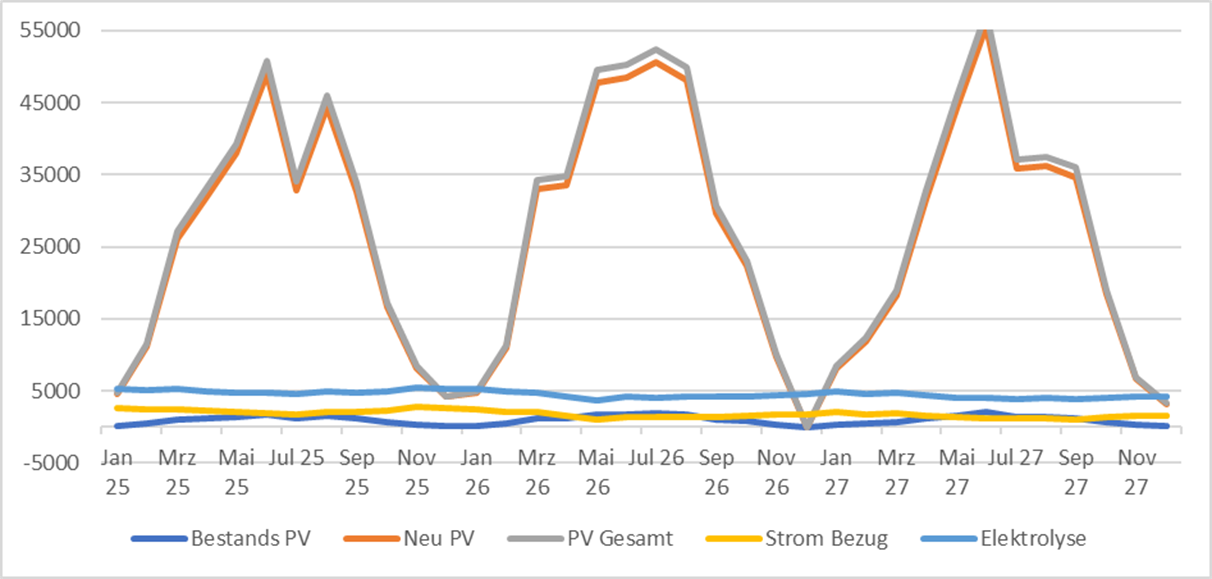
The image is a line chart displaying various data points over a timeline from January to November, covering the years 2025 to 2027. The chart includes multiple lines representing „Bestands PV,“ „Neu PV,“ „PV Gesamt,“ „Strom Bezug,“ and „Elektrolyse.“ The Y-axis ranges from -5000 to 55000, indicating changes in these values over the specified months.